
A dashboard built around a clear question
Service request overview
See what arrived and what needs a next step.
For maintenance and service businesses following requests and completion stages.
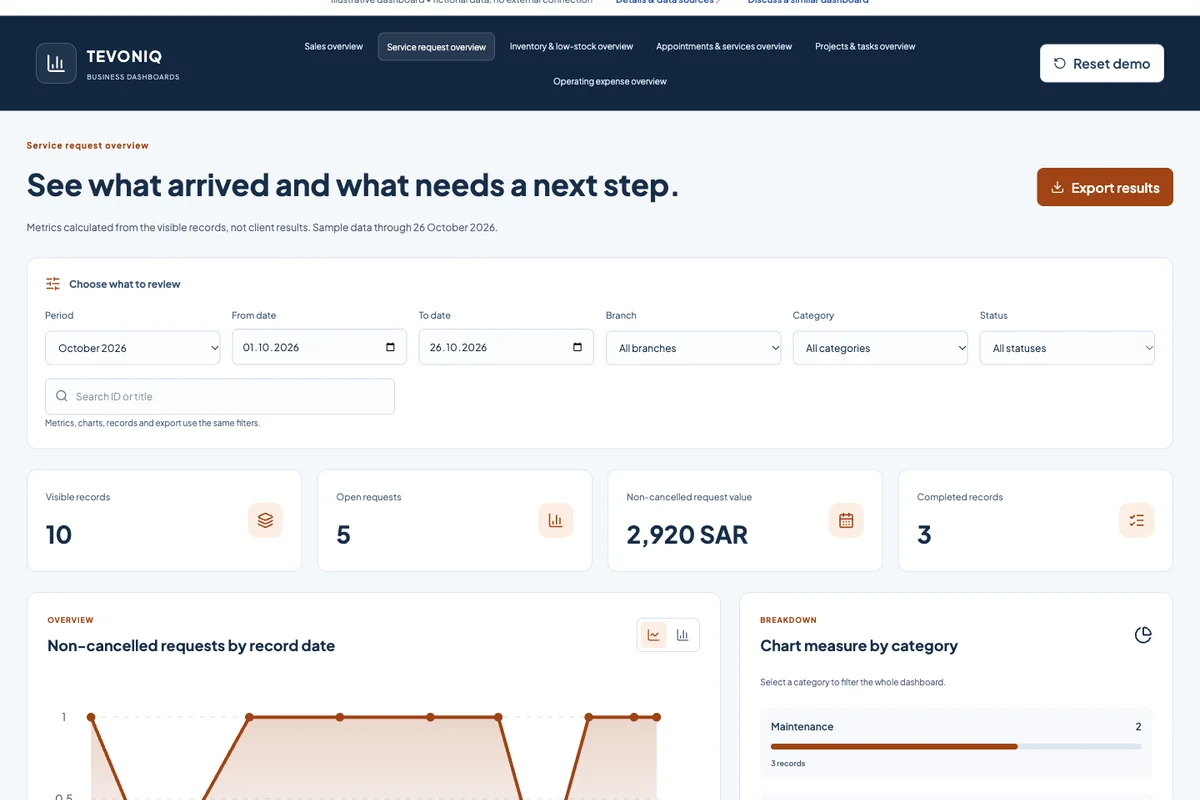
This focuses on counts and stages; it does not invent response-time or improvement claims. Data is fictional; editing and export are local, with no external storage.
Business value
- Identify open requests
- See workflow stage distribution
- Review requests by branch
Possible data sources
- Request management system
- Website service forms
- Structured tracking file
What can you try?
- Period, branch, category and status filters shared by the metrics.
- Select a category or status to filter records.
- Edit a sample record and export the visible results.
MEASURES & DEFINITIONS
What does this dashboard show?
Calculations use the same filters. In a live implementation we agree on fields, excluded statuses and units, and verify results against source records.
How do we connect your data?
We review your software or files, fields and update process. A documented API or structured export may be used, with agreed manual or scheduled refresh and a visible last-update time.
What is needed to go live?
Agreed metric definitions, verifiable data, authorised accounts and access, and checks for data quality and duplicates. We define who can view each dashboard and how refresh failures are handled before release.
Turn your records into a clearer view.
Tell us what you want to monitor, the software or file you use and who needs access. We start with a focused dashboard and expand after validating the calculations.
Discuss this dashboard’s requirements ↗